Britain has one of the largest Internet economies in the industrial world. The Internet contributes an estimated 8.3% to Britain’s GDP (Dean et al. 2012), and strongly supports domestic job and income growth by enabling access to new customers, markets and ideas. People benefit from better communications, and businesses are more likely to locate in areas with good digital access, thereby boosting local economies (Malecki & Moriset 2008). While the Internet brings clear benefits, there is also a marked inequality in its uptake and use (the so-called ‘digital divide’). We already know from the Oxford Internet Surveys (OxIS) that Internet use in Britain is strongly stratified by age, by income and by education; and yet we know almost nothing about local patterns of Internet use across the country.
A problem with national sample surveys (the usual source of data about Internet use and non-use), is that the sample sizes become too small to allow accurate generalization at smaller, sub-national areas. No one knows, for example, the proportion of Internet users in Glasgow, because national surveys simply won’t have enough respondents to make reliable city-level estimates. We know that Internet use is not evenly distributed at the regional level; Ofcom reports on broadband speeds and penetration at the county level (Ofcom 2011), and we know that London and the southeast are the most wired part of the country (Dean et al. 2012). But given the importance of the Internet, the lack of knowledge about local patterns of access and use in Britain is surprising. This is a problem because without detailed information about small areas we can’t identify where would benefit most from policy intervention to encourage Internet use and improve access.
We have begun to address this lack of information by combining two important but separate datasets — the 2011 national census, and the 2013 OxIS surveys — using the technique of small area estimation. By definition, census data are available for very small areas, and because it reaches (basically) everyone, there will be no sampling issues. Unfortunately, it is extremely expensive to collect this data, so it doesn’t collect many variables (it has no data on Internet use, for example). The second dataset, the OII’s Oxford Internet Survey (OxIS), is a very rich dataset of all kinds of Internet activity, measured with a random sample of more than 2,000 individuals across Britain. Because OxIS is unable to survey everyone in Britain, it is based on a random sample of people living in geographical ‘Output Areas’ (OAs). These areas (generally of 40-250 households) represent the fundamental building block of the national census, being the smallest geographical area for which it reports data.
Because OxIS and the census (happily) use the same OAs, we can combine national-level data on Internet use (from OxIS) with local-level demographic information (from the census) to map estimated Internet use across Britain for the first time. We can do this because we can estimate from OxIS the likelihood of an individual using the Internet just from basic demographic data (age, income, education etc.). And because the census records these demographics for everyone in each OA, we can go on to estimate the likely proportion of Internet users in each of these areas. By combining the richness of OxIS survey data with the comprehensive small area coverage of the census we can use the strengths of one to offset the gaps in the other.
Of course, this procedure assumes that people in small areas will generally match national patterns of Internet use; ie that those who are better educated, employed, and young, are more likely to use the Internet. We assume that this pattern isn’t affected by cultural or social factors (e.g. ‘Northerners just like the Internet more’), or by anything unusual about a particular group of households that makes it buck national trends (eg ‘the young people of Wytham Street, Oxford just prefer not to use the Internet’).
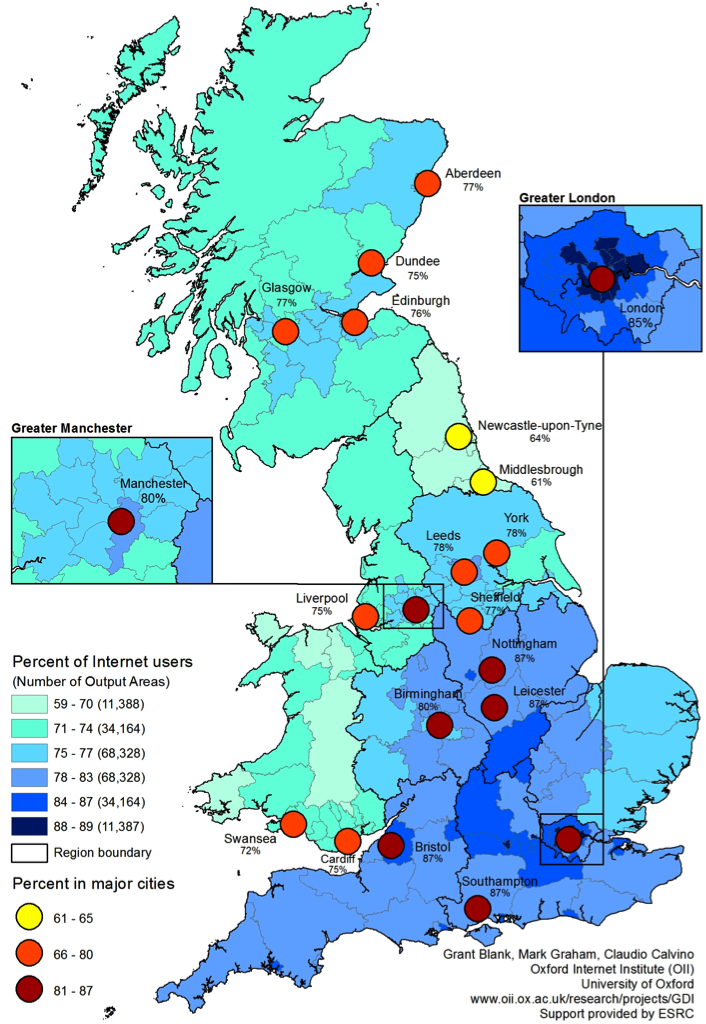
So what do we see when we combine the two datasets? What are the local-level patterns of Internet use across Britain? We can see from the figure that the highest estimated Internet use (88-89%) is concentrated in the south east, with London dominating. Bristol, Southampton, and Nottingham also have high levels of use, as well as the rest of the south (interestingly, including rural Cornwall) with estimated usage levels of 78-83%. Leeds, York and Manchester are also in this category. In the lowest category (59-70% use) we find the entire North East region. Cities show much the same pattern, with southern cities having the highest estimated Internet use, and Newcastle and Middlesbrough having the lowest.
There isn’t room in this post to explore and discuss all the patterns (or to speculate on the underlying reasons), but there are clear policy implications from this work. The Internet has made an enormous difference in our social life, culture, and economy; this is why it is important to bring people online, to encourage them all to participate and benefit. However, despite the importance of the Internet in Britain today, we still know very little about who is, and isn’t connected. We hope this approach (and this data) can help pinpoint the areas of greatest need. For example, the North East is striking — even the cities don’t seem to stand out from the surrounding rural areas. Allocating resources to improve use in the North East would probably be valuable, with rural areas as a secondary priority. Interestingly, Cornwall (despite being very rural) is actually above average in terms of likely Internet users, and is also the recipient of a major European Regional Development Fund effort to extend their broadband.
Actually getting access via fibre-optic cable is just one part of the story of Internet use (and one we don’t cover in this post); but this is the first time we have been estimate the likely use at a local level, based on the known characteristics of the people who live there. Using these small area estimation techniques opens a whole new area for social media research and policy-making around local patterns of digital participation. Going forward, we intend to expand the model to include urban-rural differences, the index of multiple deprivation, occupation, and socio-economic status. But there’s already much more we can do with these data.
References
Dean, D., DiGrande, S., Field, D., Lundmark, A., O’Day, J., Pineda, J., Zwillenberg, P. (2012) The connected world: The Internet economy in the G-20. Boston: Boston Consulting Group.
Malecki, E.J. & Moriset, B. (2008) The digital economy: Business organization, production processes and regional developments. London: Routledge.
Ofcom (2011) Communications infrastructure report: Fixed broadband data. [accessed on 23/9/2013 from http://stakeholders.ofcom.org.uk/binaries/research/broadband-research/Fixed_Broadband_June_2011.pdf ]
Read the full paper: Blank, G., Graham, M., and Calvino, C. (2014) Mapping the Local Geographies of Digital Inequality. [contact the authors for the paper and citation details]
Grant Blank is a Survey Research Fellow at the OII. He is a sociologist who studies the social and cultural impact of the Internet and other new communication media. He is principal investigator on the OII’s Geography of Digital Inequality project, which combines OxIS and census data to produce the first detailed geographic estimates of Internet use across the UK.


